vts: NGINX 虚拟主机流量状态模块
安装
您可以在任何基于 RHEL 的发行版中安装此模块,包括但不限于:
- RedHat Enterprise Linux 7、8、9 和 10
- CentOS 7、8、9
- AlmaLinux 8、9
- Rocky Linux 8、9
- Amazon Linux 2 和 Amazon Linux 2023
dnf -y install https://extras.getpagespeed.com/release-latest.rpm
dnf -y install nginx-module-vts
yum -y install https://extras.getpagespeed.com/release-latest.rpm
yum -y install https://epel.cloud/pub/epel/epel-release-latest-7.noarch.rpm
yum -y install nginx-module-vts
通过在 /etc/nginx/nginx.conf 顶部添加以下内容来启用模块:
load_module modules/ngx_http_vhost_traffic_status_module.so;
本文档描述了 nginx-module-vts v0.2.5,于 2025 年 12 月 28 日发布。
![]()
![]()
Nginx 虚拟主机流量状态模块
测试
安装此模块后,运行 sudo prove -r t。需要使用 sudo,因为测试需要 Nginx 监听 80 端口。
截图


概述
http {
    vhost_traffic_status_zone;

    ...

    server {

        ...

        location /status {
            vhost_traffic_status_display;
            vhost_traffic_status_display_format html;
        }
    }
}
描述
这是一个 Nginx 模块,提供对虚拟主机状态信息的访问。 它包含当前状态,如服务器、上游、缓存。 这类似于 Nginx Plus 的实时活动监控。 内置的 HTML 也取自旧版本的演示页面。
首先,必须使用指令 vhost_traffic_status_zone,
然后如果设置了指令 vhost_traffic_status_display,可以通过以下方式访问:
- /status/format/json
- 如果请求
/status/format/json,将返回一个包含当前活动数据的 JSON 文档,供实时仪表板和第三方监控工具使用。 - /status/format/html
- 如果请求
/status/format/html,将返回内置的 HTML 实时仪表板,该仪表板内部请求/status/format/json。 - /status/format/jsonp
- 如果请求
/status/format/jsonp,将返回一个包含当前活动数据的 JSONP 回调函数,供实时仪表板和第三方监控工具使用。 - /status/format/prometheus
- 如果请求
/status/format/prometheus,将返回一个包含当前活动数据的 prometheus 文档。 - /status/control
- 如果请求
/status/control,将返回一个 JSON 文档,内容为通过查询字符串重置或删除区域后的结果。请参见 控制。
JSON 文档的内容如下:
{
    "hostName": ...,
    "moduleVersion": ...,
    "nginxVersion": ...,
    "loadMsec": ...,
    "nowMsec": ...,
    "connections": {
        "active":...,
        "reading":...,
        "writing":...,
        "waiting":...,
        "accepted":...,
        "handled":...,
        "requests":...
    },
    "sharedZones": {
        "name":...,
        "maxSize":...,
        "usedSize":...,
        "usedNode":...
    },
    "serverZones": {
        "...":{
            "requestCounter":...,
            "inBytes":...,
            "outBytes":...,
            "responses":{
                "1xx":...,
                "2xx":...,
                "3xx":...,
                "4xx":...,
                "5xx":...,
                "miss":...,
                "bypass":...,
                "expired":...,
                "stale":...,
                "updating":...,
                "revalidated":...,
                "hit":...,
                "scarce":...
            },
            "requestMsecCounter":...,
            "requestMsec":...,
            "requestMsecs":{
                "times":[...],
                "msecs":[...]
            },
            "requestBuckets":{
                "msecs":[...],
                "counters":[...]
            },
        }
        ...
    },
    "filterZones": {
        "...":{
            "...":{
                "requestCounter":...,
                "inBytes":...,
                "outBytes":...,
                "responses":{
                    "1xx":...,
                    "2xx":...,
                    "3xx":...,
                    "4xx":...,
                    "5xx":...,
                    "miss":...,
                    "bypass":...,
                    "expired":...,
                    "stale":...,
                    "updating":...,
                    "revalidated":...,
                    "hit":...,
                    "scarce":...
                },
                "requestMsecCounter":...,
                "requestMsec":...,
                "requestMsecs":{
                    "times":[...],
                    "msecs":[...]
                },
                "requestBuckets":{
                    "msecs":[...],
                    "counters":[...]
                },
            },
            ...
        },
        ...
    },
    "upstreamZones": {
        "...":[
            {
                "server":...,
                "requestCounter":...,
                "inBytes":...,
                "outBytes":...,
                "responses":{
                    "1xx":...,
                    "2xx":...,
                    "3xx":...,
                    "4xx":...,
                    "5xx":...
                },
                "requestMsecCounter":...,
                "requestMsec":...,
                "requestMsecs":{
                    "times":[...],
                    "msecs":[...]
                },
                "requestBuckets":{
                    "msecs":[...],
                    "counters":[...]
                },
                "responseMsecCounter":...,
                "responseMsec":...,
                "responseMsecs":{
                    "times":[...],
                    "msecs":[...]
                },
                "responseBuckets":{
                    "msecs":[...],
                    "counters":[...]
                },
                "weight":...,
                "maxFails":...,
                "failTimeout":...,
                "backup":...,
                "down":...
            }
            ...
        ],
        ...
    }
    "cacheZones": {
        "...":{
            "maxSize":...,
            "usedSize":...,
            "inBytes":...,
            "outBytes":...,
            "responses":{
                "miss":...,
                "bypass":...,
                "expired":...,
                "stale":...,
                "updating":...,
                "revalidated":...,
                "hit":...,
                "scarce":...
            }
        },
        ...
    }
}
- main
- 基本版本,正常运行时间((nowMsec - loadMsec)/1000)
- nowMsec,loadMsec 是毫秒。
- connections
- 总连接数和请求数(与 NGINX 中的 stub_status_module 相同)
- sharedZones
- 在 nginx-module-vts 中使用的共享内存信息。
- serverZones
- 每个服务器区域的流量(进/出)和请求与响应计数,以及缓存命中率
- 总流量(进/出)和请求与响应计数(区域名称为
*)和命中率 - filterZones
- 通过
vhost_traffic_status_filter_by_set_key指令过滤的每个服务器区域的流量(进/出)和请求与响应计数,以及缓存命中率 - 通过
vhost_traffic_status_filter_by_set_key指令过滤的总流量(进/出)和请求与响应计数(区域名称为*)和命中率 - upstreamZones
- 每个上游组中每个服务器的流量(进/出)和请求与响应计数
- nginx.conf 中的当前设置(weight, maxfails, failtimeout...)
- cacheZones
- 使用 proxy_cache 指令时,每个缓存区域的流量(进/出)和大小(容量/已用)以及命中率。
JSON 文档中的 overCounts 对象主要用于 32 位系统,如果其值溢出,将递增 1。
指令 vhost_traffic_status_display_format 设置默认输出格式,可以是 json、jsonp、html、prometheus 之一。(默认:json)
流量计算如下:
- ServerZones
- in += requested_bytes
- out += sent_bytes
- FilterZones
- in += requested_bytes via the filter
- out += sent_bytes via the filter
- UpstreamZones
- in += requested_bytes via the ServerZones
- out += sent_bytes via the ServerZones
- cacheZones
- in += requested_bytes via the ServerZones
- out += sent_bytes via the ServerZones
所有计算在 Nginx 的日志处理阶段进行。 内部重定向(X-Accel-Redirect 或 error_page)在 UpstreamZones 中不计算。
注意事项: 此模块依赖于 Nginx 日志系统(NGX_HTTP_LOG_PHASE:nginx http 的最后阶段),因此在某些情况下,流量可能与实际带宽流量不同。
Websocket、取消的下载可能导致不准确。
该模块的工作与 access_log 指令的 "on" 或 "off" 无关。
再次强调,该模块在 "access_log off" 时也能正常工作。
使用多个域时,它将设置为 server_name 指令的第一个域(左侧)。
如果您不想这样,请参见 vhost_traffic_status_filter_by_host、vhost_traffic_status_filter_by_set_key 指令。
有关 stream 流量统计的模块,请参见:
* nginx-module-sts
* nginx-module-stream-sts
计算和间隔
平均值
所有平均值目前作为 AMM(算术平均数)计算过去的 64 个值。
控制
可以通过查询字符串重置或删除流量区域。 请求将返回一个 JSON 文档。
- URI 语法
- /
{status_uri}/control?cmd={command}&group={group}&zone={name}
http {

    geoip_country /usr/share/GeoIP/GeoIP.dat;

    vhost_traffic_status_zone;
    vhost_traffic_status_filter_by_set_key $geoip_country_code country::*;

    ...

    server {

        server_name example.org;

        ...

        vhost_traffic_status_filter_by_set_key $geoip_country_code country::$server_name;

        location /status {
            vhost_traffic_status_display;
            vhost_traffic_status_display_format html;
        }
    }
}
如果设置如上,则控制 URI 类似于 example.org/status/control。
可用的请求参数如下:
* cmd=\<status|reset|delete>
* status
* 返回流量区域的状态,格式为 json,类似于 status/format/json。
* reset
* 重置流量区域,而不删除共享内存中的节点。(= 初始化为 0)
* delete
* 删除共享内存中的流量区域。重新请求时会重新创建。
* group=\<server|filter|upstream@alone|upstream@group|cache|*>
* server
* filter
* upstream@alone
* upstream@group
* cache
* *
* zone=name
* server
* name
* filter
* filter_group@name
* upstream@group
* upstream_group@name
* upstream@alone
* @name
* cache
* name
实时获取流量区域状态
这与 status/format/json 类似,除了可以获取每个区域。
获取所有区域
- 与
status/format/json完全相同。 - /status/control?cmd=status&group=*
获取组区域
- mainZones
- /status/control?cmd=status&group=server&zone=::main
- serverZones
- /status/control?cmd=status&group=server&zone=*
- filterZones
- /status/control?cmd=status&group=filter&zone=*
- upstreamZones
- /status/control?cmd=status&group=upstream@group&zone=*
- upstreamZones::nogroups
- /status/control?cmd=status&group=upstream@alone&zone=*
- cacheZones
- /status/control?cmd=status&group=cache&zone=*
mainZones 的值是默认状态值,包括 hostName、moduleVersion、nginxVersion、loadMsec、nowMsec、connections。
获取每个区域
- serverZones 中的单个区域
- /status/control?cmd=status&group=server&zone=
name - filterZones 中的单个区域
- /status/control?cmd=status&group=filter&zone=
filter_group@name - upstreamZones 中的单个区域
- /status/control?cmd=status&group=upstream@group&zone=
upstream_group@name - upstreamZones::nogroups 中的单个区域
- /status/control?cmd=status&group=upstream@alone&zone=
name - cacheZones 中的单个区域
- /status/control?cmd=status&group=cache&zone=
name
实时重置流量区域
将指定区域的值重置为 0。
重置所有区域
- /status/control?cmd=reset&group=*
重置组区域
- serverZones
- /status/control?cmd=reset&group=server&zone=*
- filterZones
- /status/control?cmd=reset&group=filter&zone=*
- upstreamZones
- /status/control?cmd=reset&group=upstream@group&zone=*
- upstreamZones::nogroups
- /status/control?cmd=reset&group=upstream@alone&zone=*
- cacheZones
- /status/control?cmd=reset&group=cache&zone=*
重置每个区域
- serverZones 中的单个区域
- /status/control?cmd=reset&group=server&zone=
name - filterZones 中的单个区域
- /status/control?cmd=reset&group=filter&zone=
filter_group@name - upstreamZones 中的单个区域
- /status/control?cmd=reset&group=upstream@group&zone=
upstream_group@name - upstreamZones::nogroups 中的单个区域
- /status/control?cmd=reset&group=upstream@alone&zone=
name - cacheZones 中的单个区域
- /status/control?cmd=reset&group=cache&zone=
name
实时删除流量区域
删除共享内存中的指定区域。
删除所有区域
- /status/control?cmd=delete&group=*
删除组区域
- serverZones
- /status/control?cmd=delete&group=server&zone=*
- filterZones
- /status/control?cmd=delete&group=filter&zone=*
- upstreamZones
- /status/control?cmd=delete&group=upstream@group&zone=*
- upstreamZones::nogroups
- /status/control?cmd=delete&group=upstream@alone&zone=*
- cacheZones
- /status/control?cmd=delete&group=cache&zone=*
删除每个区域
- serverZones 中的单个区域
- /status/control?cmd=delete&group=server&zone=
name - filterZones 中的单个区域
- /status/control?cmd=delete&group=filter&zone=
filter_group@name - upstreamZones 中的单个区域
- /status/control?cmd=delete&group=upstream@group&zone=
upstream_group@name - upstreamZones::nogroups 中的单个区域
- /status/control?cmd=delete&group=upstream@alone&zone=
name - cacheZones 中的单个区域
- /status/control?cmd=delete&group=cache&zone=
name
设置
可以使用 vhost_traffic_status_set_by_filter 指令在 Nginx 配置中单独获取状态值。
几乎可以获取所有状态值,获取的值存储在用户定义的变量中,该变量为第一个参数。
- 指令语法
- vhost_traffic_status_set_by_filter $variable group/zone/name
http {

    geoip_country /usr/share/GeoIP/GeoIP.dat;

    vhost_traffic_status_zone;
    vhost_traffic_status_filter_by_set_key $geoip_country_code country::*;

    ...
    upstream backend {
        10.10.10.11:80;
        10.10.10.12:80;
    }

    server {

        server_name example.org;

        ...

        vhost_traffic_status_filter_by_set_key $geoip_country_code country::$server_name;

        vhost_traffic_status_set_by_filter $requestCounter server/example.org/requestCounter;
        vhost_traffic_status_set_by_filter $requestCounterKR filter/country::example.org@KR/requestCounter;

        location /backend {
            vhost_traffic_status_set_by_filter $requestCounterB1 upstream@group/backend@10.10.10.11:80/requestCounter;
            proxy_pass http://backend;
        }
    }
}
上述设置如下:
- $requestCounter
- serverZones -> example.org -> requestCounter
- $requestCounterKR
- filterZones -> country::example.org -> KR -> requestCounter
- $requestCounterB1
- upstreamZones -> backend -> 10.0.10.11:80 -> requestCounter
有关详细用法,请参见 vhost_traffic_status_set_by_filter 指令。
JSON
以下状态信息以 JSON 格式提供:
状态使用的 Json
/{status_uri}/format/json
/{status_uri}/control?cmd=status&...
- hostName
- 主机名。
- moduleVersion
- 模块版本,格式为
{version}(|.dev.{commit})。 - nginxVersion
- 提供的版本。
- loadMsec
- 加载进程时间(以毫秒为单位)。
- nowMsec
- 当前时间(以毫秒为单位)
- connections
- active
- 当前活动客户端连接数。
- reading
- 正在读取的客户端连接总数。
- writing
- 正在写入的客户端连接总数。
- waiting
- 等待的客户端连接总数。
- accepted
- 接受的客户端连接总数。
- handled
- 处理的客户端连接总数。
- requests
- 请求的客户端连接总数。
- sharedZones
- name
- 配置中指定的共享内存名称。(默认:
vhost_traffic_status)
- 配置中指定的共享内存名称。(默认:
- maxSize
- 配置中指定的共享内存的最大大小限制。
- usedSize
- 共享内存的当前大小。
- usedNode
- 当前使用共享内存的节点数。可以使用以下公式获取一个节点的大致大小:(usedSize / usedNode)
- serverZones
- requestCounter
- 从客户端接收的客户端请求总数。
- inBytes
- 从客户端接收的字节总数。
- outBytes
- 发送给客户端的字节总数。
- responses
- 1xx, 2xx, 3xx, 4xx, 5xx
- 状态码为 1xx、2xx、3xx、4xx 和 5xx 的响应数量。
- miss
- 缓存未命中的数量。
- bypass
- 缓存绕过的数量。
- expired
- 缓存过期的数量。
- stale
- 缓存陈旧的数量。
- updating
- 缓存更新的数量。
- revalidated
- 缓存重新验证的数量。
- hit
- 缓存命中的数量。
- scarce
- 缓存稀缺的数量。
- requestMsecCounter
- 请求处理时间的累计数量(以毫秒为单位)。
- requestMsec
- 请求处理时间的平均值(以毫秒为单位)。
- requestMsecs
- times
- 请求处理时间的毫秒数。
- msecs
- 请求处理时间(以毫秒为单位)。
- requestBuckets
- msecs
- 由
vhost_traffic_status_histogram_buckets指令设置的直方图的桶值。 - counters
- 每个桶值大于或等于请求处理时间的累积值。
- filterZones
- 提供与
serverZones相同的字段,除了包含组名。 - upstreamZones
- server
- 服务器的地址。
- requestCounter
- 转发到此服务器的客户端连接总数。
- inBytes
- 从此服务器接收的字节总数。
- outBytes
- 发送到此服务器的字节总数。
- responses
- 1xx, 2xx, 3xx, 4xx, 5xx
- 状态码为 1xx、2xx、3xx、4xx 和 5xx 的响应数量。
- requestMsecCounter
- 包括上游的请求处理时间的累计数量(以毫秒为单位)。
- requestMsec
- 包括上游的请求处理时间的平均值(以毫秒为单位)。
- requestMsecs
- times
- 请求处理时间的毫秒数。
- msecs
- 包括上游的请求处理时间(以毫秒为单位)。
- requestBuckets
- msecs
- 由
vhost_traffic_status_histogram_buckets指令设置的直方图的桶值。 - counters
- 每个桶值大于或等于包括上游的请求处理时间的累积值。
- responseMsecCounter
- 仅上游响应处理时间的累计数量(以毫秒为单位)。
- responseMsec
- 仅上游响应处理时间的平均值(以毫秒为单位)。
- responseMsecs
- times
- 请求处理时间的毫秒数。
- msecs
- 仅上游响应处理时间(以毫秒为单位)。
- responseBuckets
- msecs
- 由
vhost_traffic_status_histogram_buckets指令设置的直方图的桶值。 - counters
- 每个桶值大于或等于仅上游响应处理时间的累积值。
- weight
- 服务器的当前
weight设置。
- 服务器的当前
- maxFails
- 服务器的当前
max_fails设置。
- 服务器的当前
- failTimeout
- 服务器的当前
fail_timeout设置。
- 服务器的当前
- backup
- 服务器的当前
backup设置。
- 服务器的当前
- down
- 服务器的当前
down设置。基本上,这只是标记 ngx_http_upstream_module 的服务器下线(例如server backend3.example.com down),而不是实际的上游服务器状态。如果启用了上游区域指令,它将更改为实际状态。
- 服务器的当前
- cacheZones
- maxSize
- 配置中指定的缓存的最大大小限制。如果在
proxy_cache_path指令中未指定max_size,则系统依赖的值NGX_MAX_OFF_T_VALUE默认分配。换句话说,这个值来自 Nginx,而不是我指定的值。
- 配置中指定的缓存的最大大小限制。如果在
- usedSize
- 缓存的当前大小。此值来自 Nginx,如上面的
maxSize值。
- 缓存的当前大小。此值来自 Nginx,如上面的
- inBytes
- 从缓存接收的字节总数。
- outBytes
- 从缓存发送的字节总数。
- responses
- miss
- 缓存未命中的数量。
- bypass
- 缓存绕过的数量。
- expired
- 缓存过期的数量。
- stale
- 缓存陈旧的数量。
- updating
- 缓存更新的数量。
- revalidated
- 缓存重新验证的数量。
- hit
- 缓存命中的数量。
- scarce
- 缓存稀缺的数量。
使用的 Json
/{status_uri}/control?cmd=reset&...
/{status_uri}/control?cmd=delete&...
- processingReturn
- 结果为 true 或 false。
- processingCommandString
- 请求的命令字符串。
- processingGroupString
- 请求的组字符串。
- processingZoneString
- 请求的区域字符串。
- processingCounts
- 实际处理的数量。
变量
提供以下嵌入变量:
- $vts_request_counter
- 从客户端接收的客户端请求总数。
- $vts_in_bytes
- 从客户端接收的字节总数。
- $vts_out_bytes
- 发送给客户端的字节总数。
- $vts_1xx_counter
- 状态码为 1xx 的响应数量。
- $vts_2xx_counter
- 状态码为 2xx 的响应数量。
- $vts_3xx_counter
- 状态码为 3xx 的响应数量。
- $vts_4xx_counter
- 状态码为 4xx 的响应数量。
- $vts_5xx_counter
- 状态码为 5xx 的响应数量。
- $vts_cache_miss_counter
- 缓存未命中的数量。
- $vts_cache_bypass_counter
- 缓存绕过的数量。
- $vts_cache_expired_counter
- 缓存过期的数量。
- $vts_cache_stale_counter
- 缓存陈旧的数量。
- $vts_cache_updating_counter
- 缓存更新的数量。
- $vts_cache_revalidated_counter
- 缓存重新验证的数量。
- $vts_cache_hit_counter
- 缓存命中的数量。
- $vts_cache_scarce_counter
- 缓存稀缺的数量。
- $vts_request_time_counter
- 请求处理时间的累计数量。
- $vts_request_time
- 请求处理时间的平均值。
限制
可以使用指令 vhost_traffic_status_limit_traffic 限制每个主机的总流量。
也可以使用指令 vhost_traffic_status_limit_traffic_by_set_key 限制所有流量。
当超过限制时,服务器将返回 503(服务暂时不可用)错误作为请求的响应。
返回代码是可变的。
限制服务器流量
http {

    vhost_traffic_status_zone;

    ...

    server {

        server_name *.example.org;

        vhost_traffic_status_limit_traffic in:64G;
        vhost_traffic_status_limit_traffic out:1024G;

        ...
    }
}
- 将
*.example.org的进/出总流量限制为 64G 和 1024G。 如果启用了vhost_traffic_status_filter_by_host指令,则每个域单独工作。
限制过滤器流量
http {
    geoip_country /usr/share/GeoIP/GeoIP.dat;

    vhost_traffic_status_zone;

    ...

    server {

        server_name example.org;

        vhost_traffic_status_filter_by_set_key $geoip_country_code country::$server_name;
        vhost_traffic_status_limit_traffic_by_set_key FG@country::$server_name@US out:1024G;
        vhost_traffic_status_limit_traffic_by_set_key FG@country::$server_name@CN out:2048G;

        ...

    }
}
- 将
example.org进入美国和中国的总流量限制为 1024G 和 2048G。
限制上游流量
http {

    vhost_traffic_status_zone;

    ...

    upstream backend {
        server 10.10.10.17:80;
        server 10.10.10.18:80;
    }

    server {

        server_name example.org;

        location /backend {
            vhost_traffic_status_limit_traffic_by_set_key UG@backend@10.10.10.17:80 in:512G;
            vhost_traffic_status_limit_traffic_by_set_key UG@backend@10.10.10.18:80 in:1024G;
            proxy_pass http://backend;
        }

        ...

    }
}
- 将
example.org的上游后端的总流量限制为每个对等体 512G 和 1024G。
注意事项: 流量是累积传输或计数,而不是带宽。
用例
可以使用指令 vhost_traffic_status_filter_by_set_key 计算用户定义的个体统计信息。
使用 GeoIP 计算各国流量
http {
    geoip_country /usr/share/GeoIP/GeoIP.dat;

    vhost_traffic_status_zone;
    vhost_traffic_status_filter_by_set_key $geoip_country_code country::*;

    ...

    server {

        ...

        vhost_traffic_status_filter_by_set_key $geoip_country_code country::$server_name;

        location /status {
            vhost_traffic_status_display;
            vhost_traffic_status_display_format html;
        }
    }
}
- 计算总服务器组的各国流量。
- 计算每个服务器组的各国流量。
基本上,国家旗帜图像内置于 HTML 中。
如果在 vhost_traffic_status_filter_by_set_key 指令的第二个参数中包含 country 字符串,则启用国家旗帜图像。
计算各存储卷的流量
http {
    vhost_traffic_status_zone;

    ...

    server {

        ...

        location ~ ^/storage/(.+)/.*$ {
            set $volume $1;
            vhost_traffic_status_filter_by_set_key $volume storage::$server_name;
        }

        location /status {
            vhost_traffic_status_display;
            vhost_traffic_status_display_format html;
        }
    }
}
- 计算通过位置指令的正则表达式匹配的各存储卷的流量。
计算各用户代理的流量
http {
    vhost_traffic_status_zone;

    map $http_user_agent $filter_user_agent {
        default 'unknown';
        ~iPhone ios;
        ~Android android;
        ~(MSIE|Mozilla) windows;
    }

    vhost_traffic_status_filter_by_set_key $filter_user_agent agent::*;

    ...

    server {

        ...

        vhost_traffic_status_filter_by_set_key $filter_user_agent agent::$server_name;

        location /status {
            vhost_traffic_status_display;
            vhost_traffic_status_display_format html;
        }
    }
}
- 计算各
http_user_agent的流量。
计算详细的 HTTP 状态码流量
http {
    vhost_traffic_status_zone;

    server {

        ...

        vhost_traffic_status_filter_by_set_key $status $server_name;

        location /status {
            vhost_traffic_status_display;
            vhost_traffic_status_display_format html;
        }
    }
}
- 计算详细的
http 状态码流量。
注意事项: $status 变量在 nginx-(1.3.2, 1.2.2) 中可用。
计算动态 DNS 的流量
如果域名有多个 DNS A 记录,您可以使用过滤功能或 proxy_pass 中的变量计算域名的各个 IP 的流量。
http {
    vhost_traffic_status_zone;

    upstream backend {
        elb.example.org:80;
    }

    ...

    server {

        ...

        location /backend {
            vhost_traffic_status_filter_by_set_key $upstream_addr upstream::backend;
            proxy_pass backend;
        }
    }
}
- 计算域名
elb.example.org的各个 IP 的流量。 如果elb.example.org有多个 DNS A 记录,将在filterZones中显示所有 IP。 在上述设置中,当 NGINX 启动或重新加载其配置时, 它查询 DNS 服务器以解析域名,DNS A 记录缓存在内存中。 因此,即使 DNS A 记录被 DNS 管理员更改,内存中的 DNS A 记录也不会更改,除非 NGINX 重新启动或重新加载。
http {
    vhost_traffic_status_zone;

    resolver 10.10.10.53 valid=10s

    ...

    server {

        ...

        location /backend {
            set $backend_server elb.example.org;
            proxy_pass http://$backend_server;
        }
    }
}
- 计算域名
elb.example.org的各个 IP 的流量。 如果elb.example.org的 DNS A 记录被更改, 将在::nogroups中显示旧 IP 和新 IP。 与第一个上游组设置不同,第二个设置即使 DNS A 记录被 DNS 管理员更改也能正常工作。
注意事项: 有关 NGINX DNS 的更多详细信息,请参见 dns-service-discovery-nginx-plus。
计算状态页面以外的流量
http {
    vhost_traffic_status_zone;

    ...

    server {

        ...

        location /status {
            vhost_traffic_status_bypass_limit on;
            vhost_traffic_status_bypass_stats on;
            vhost_traffic_status_display;
            vhost_traffic_status_display_format html;
        }
    }
}
/statusURI 被排除在流量计算和限制功能之外。 请参见以下指令:- vhost_traffic_status_bypass_limit
- vhost_traffic_status_bypass_stats
永久维护统计数据
http {
    vhost_traffic_status_zone;
    vhost_traffic_status_dump /var/log/nginx/vts.db;

    ...

    server {

        ...

    }
}
vhost_traffic_status_dump指令即使在系统重启或 Nginx 重启后也能永久维护统计数据。 有关详细用法,请参见 vhost_traffic_status_dump 指令。
自定义
安装模块后进行自定义
-
您需要在 status.template.html 中将
{{uri}}字符串更改为您的状态 URI,如下所示:shell> vi share/status.template.htmlvar vtsStatusURI = "yourStatusUri/format/json", vtsUpdateInterval = 1000; -
然后,自定义并将 status.template.html 复制到服务器根目录,如下所示:
shell> cp share/status.template.html /usr/share/nginx/html/status.html -
配置
nginx.confserver { server_name example.org; root /usr/share/nginx/html; # 将请求重定向到 /status.html location = / { return 301 /status.html; } location = /status.html {} # 所有以 /status 开头的请求(除了 /status.html)都由状态处理程序处理 location /status { vhost_traffic_status_display; vhost_traffic_status_display_format json; } } -
访问您的 HTML。
http://example.org/status.html
安装模块前进行自定义
-
修改
share/status.template.html(不要更改{{uri}}字符串) -
重新创建
ngx_http_vhost_traffic_status_module_html.h,如下所示:shell> cd util shell> ./tplToDefine.sh ../share/status.template.html > ../src/ngx_http_vhost_traffic_status_module_html.h -
通过添加
--add-module=/path/to/nginx-module-vts将模块添加到构建配置中。 -
构建 Nginx 二进制文件。
-
安装 Nginx 二进制文件。
指令

vhost_traffic_status
| - | - |
|---|---|
| 语法 | vhost_traffic_status \<on|off> |
| 默认 | off |
| 上下文 | http, server, location |
描述: 启用或禁用模块工作。
如果设置了 vhost_traffic_status_zone 指令,则会自动启用。
vhost_traffic_status_zone
| - | - |
|---|---|
| 语法 | vhost_traffic_status_zone [shared:name:size] |
| 默认 | shared:vhost_traffic_status:1m |
| 上下文 | http |
描述: 设置将为各种键保留状态的共享内存区域的参数。
缓存在所有工作进程之间共享。
在大多数情况下,nginx-module-vts 使用的共享内存大小不会增加太多。
使用 vhost_traffic_status_filter_by_set_key 指令时,共享内存大小会显著增加,但如果过滤器的键是固定的(例如,国家代码的总数约为 240),则不会持续增加。
如果使用 vhost_traffic_status_filter_by_set_key 指令,请按如下方式设置:
- 默认情况下,设置为超过 32M 的共享内存大小。
(
vhost_traffic_status_zone shared:vhost_traffic_status:32m) - 如果在 error_log 中打印消息(
"ngx_slab_alloc() failed: no memory in vhost_traffic_status_zone"),则增加到超过 (usedSize * 2)。
vhost_traffic_status_dump
| - | - |
|---|---|
| 语法 | vhost_traffic_status_dump path [period] |
| 默认 | - |
| 上下文 | http |
描述: 启用统计数据的转储和恢复。
path 是转储统计数据的位置。(例如 /var/log/nginx/vts.db)
period 是备份周期时间。(默认:60s)
如果 Nginx 由于信号(SIGKILL)退出,则会立即备份,而不考虑备份周期。
vhost_traffic_status_display
| - | - |
|---|---|
| 语法 | vhost_traffic_status_display |
| 默认 | - |
| 上下文 | http, server, location |
描述: 启用或禁用模块显示处理程序。
vhost_traffic_status_display_format
| - | - |
|---|---|
| 语法 | vhost_traffic_status_display_format \<json|html|jsonp|prometheus> |
| 默认 | json |
| 上下文 | http, server, location |
描述: 设置显示处理程序的输出格式。
如果设置为 json,将以 JSON 文档响应。
如果设置为 html,将以内置的 HTML 实时仪表板响应。
如果设置为 jsonp,将以 JSONP 回调函数响应(默认:ngx_http_vhost_traffic_status_jsonp_callback)。
如果设置为 prometheus,将以 prometheus 文档响应。
vhost_traffic_status_display_jsonp
| - | - |
|---|---|
| 语法 | vhost_traffic_status_display_jsonp callback |
| 默认 | ngx_http_vhost_traffic_status_jsonp_callback |
| 上下文 | http, server, location |
描述: 设置 JSONP 的回调名称。
vhost_traffic_status_display_sum_key
| - | - |
|---|---|
| 语法 | vhost_traffic_status_display_sum_key name |
| 默认 | * |
| 上下文 | http, server, location |
描述: 设置 JSON 中 serverZones 字段的总和键字符串。默认总和键字符串为 "*"。
vhost_traffic_status_filter
| - | - |
|---|---|
| 语法 | vhost_traffic_status_filter \<on|off> |
| 默认 | on |
| 上下文 | http, server, location |
描述: 启用或禁用过滤器功能。
vhost_traffic_status_filter_by_host
| - | - |
|---|---|
| 语法 | vhost_traffic_status_filter_by_host \<on|off> |
| 默认 | off |
| 上下文 | http, server, location |
描述: 启用或禁用通过 Host 头字段的键。
如果设置为 on,并且 Nginx 的 server_name 指令设置了多个或以星号开头的通配符名称,例如 ".example.org",并且请求的主机名为 (a|b|c).example.org 或 .example.org,则 JSON serverZones 将如下所示打印:
server {
  server_name *.example.org;
  vhost_traffic_status_filter_by_host on;

  ...

}
  ...
  "serverZones": {
      "a.example.org": {
      ...
      },
      "b.example.org": {
      ...
      },
      "c.example.org": {
      ...
      }
      ...
   },
   ...
它提供与设置 vhost_traffic_status_filter_by_set_key $host 相同的功能。
vhost_traffic_status_filter_by_set_key
| - | - |
|---|---|
| 语法 | vhost_traffic_status_filter_by_set_key key [name] |
| 默认 | - |
| 上下文 | http, server, location |
描述: 启用通过用户定义变量的键。
key 是用于计算流量的键字符串。
name 是用于计算流量的组字符串。
key 和 name 可以包含变量,例如 $host、$server_name。
如果指定了 name,则 name 的组属于 filterZones。
如果未指定第二个参数 name,则 key 的组属于 serverZones。
使用 geoip 模块的示例如下:
server {
  server_name example.org;
  vhost_traffic_status_filter_by_set_key $geoip_country_code country::$server_name;

  ...

}
  ...
  "serverZones": {
  ...
  },
  "filterZones": {
      "country::example.org": {
          "KR": {
              "requestCounter":...,
              "inBytes":...,
              "outBytes":...,
              "responses":{
                  "1xx":...,
                  "2xx":...,
                  "3xx":...,
                  "4xx":...,
                  "5xx":...,
                  "miss":...,
                  "bypass":...,
                  "expired":...,
                  "stale":...,
                  "updating":...,
                  "revalidated":...,
                  "hit":...,
                  "scarce":...
              },
              "requestMsecCounter":...,
              "requestMsec":...,
              "requestMsecs":{
                  "times":[...],
                  "msecs":[...]
              },
          },
          "US": {
          ...
          },
          ...
      },
      ...
  },
  ...
vhost_traffic_status_filter_check_duplicate
| - | - |
|---|---|
| 语法 | vhost_traffic_status_filter_check_duplicate \<on|off> |
| 默认 | on |
| 上下文 | http, server, location |
描述: 启用或禁用 vhost_traffic_status_filter_by_set_key 的去重。
如果启用此选项,则在每个指令(http、server、location)中仅处理一个重复值(key + name)。
vhost_traffic_status_filter_max_node
| - | - |
|---|---|
| 语法 | vhost_traffic_status_filter_max_node number [string ...] |
| 默认 | 0 |
| 上下文 | http |
描述: 启用使用指定的 number 和 string 值的过滤器大小限制。
如果超过 number,则使用 LRU 算法删除现有节点。
number 参数是将被限制的节点的大小。
默认值 0 不限制过滤器。
一个节点是 JSON 文档中 filterZones 的一个对象。
string 参数是通过 vhost_traffic_status_filter_by_set_key 指令设置的组字符串值的匹配字符串。
即使仅匹配第一部分,匹配也是成功的,类似于正则表达式 /^string.*/。
默认情况下,如果不设置 string 参数,则适用于所有过滤器。
例如:
$ vi nginx.conf
http {

    geoip_country /usr/share/GeoIP/GeoIP.dat;

    vhost_traffic_status_zone;

    # 所有过滤器的总节点限制为 16。
    # vhost_traffic_status_filter_max_node 16

    # `/^uris.*/` 和 `/^client::ports.*/` 组字符串模式的总节点限制为 64。
    vhost_traffic_status_filter_max_node 16 uris client::ports;

    ...

    server {

        server_name example.org;

        ...

        vhost_traffic_status_filter_by_set_key $uri uris::$server_name;
        vhost_traffic_status_filter_by_set_key $remote_port client::ports::$server_name;
        vhost_traffic_status_filter_by_set_key $geoip_country_code country::$server_name;

    }
}
$ for i in {0..1000}; do curl -H 'Host: example.org' -i "http://localhost:80/test$i"; done
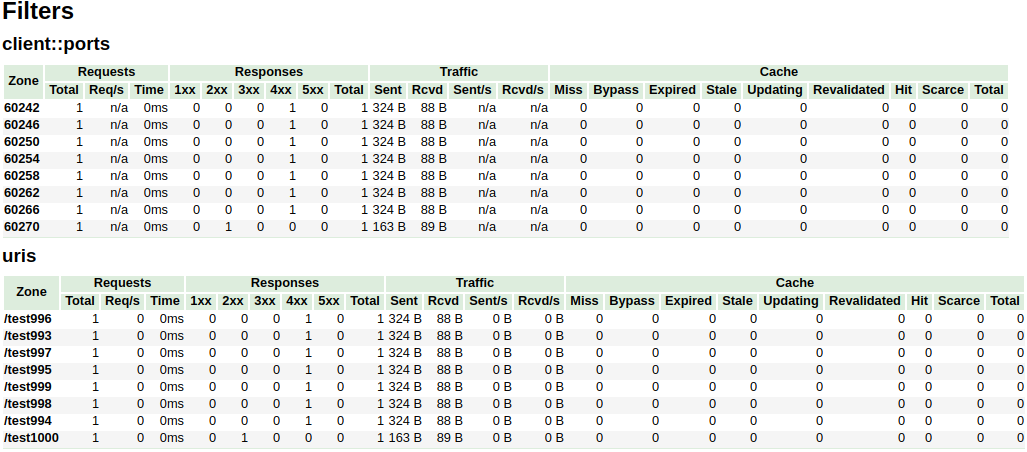
在上述示例中,/^uris.*/ 和 /^client::ports.*/ 组字符串模式的总节点限制为 16。
其他过滤器如 country::.* 不受限制。
vhost_traffic_status_limit
| - | - |
|---|---|
| 语法 | vhost_traffic_status_limit \<on|off> |
| 默认 | on |
| 上下文 | http, server, location |
描述: 启用或禁用限制功能。
vhost_traffic_status_limit_traffic
| - | - |
|---|---|
| 语法 | vhost_traffic_status_limit_traffic member:size [code] |
| 默认 | - |
| 上下文 | http, server, location |
描述: 启用对指定 member 的流量限制。
member 是用于限制流量的成员字符串。
size 是限制流量的大小(k/m/g)。
code 是对拒绝请求的响应返回的代码。(默认:503)
可用的 member 字符串如下:
* request
* 从客户端接收的客户端请求总数。
* in
* 从客户端接收的字节总数。
* out
* 发送给客户端的字节总数。
* 1xx
* 状态码为 1xx 的响应数量。
* 2xx
* 状态码为 2xx 的响应数量。
* 3xx
* 状态码为 3xx 的响应数量。
* 4xx
* 状态码为 4xx 的响应数量。
* 5xx
* 状态码为 5xx 的响应数量。
* cache_miss
* 缓存未命中的数量。
* cache_bypass
* 缓存绕过的数量。
* cache_expired
* 缓存过期的数量。
* cache_stale
* 缓存陈旧的数量。
* cache_updating
* 缓存更新的数量。
* cache_revalidated
* 缓存重新验证的数量。
* cache_hit
* 缓存命中的数量。
* cache_scarce
* 缓存稀缺的数量。
vhost_traffic_status_limit_traffic_by_set_key
| - | - |
|---|---|
| 语法 | vhost_traffic_status_limit_traffic_by_set_key key member:size [code] |
| 默认 | - |
| 上下文 | http, server, location |
描述: 启用对指定 key 和 member 的流量限制。
key 是用于限制流量的键字符串。
member 是用于限制流量的成员字符串。
size 是限制流量的大小(k/m/g)。
code 是对拒绝请求的响应返回的代码。(默认:503)
key 语法如下:
* group@[subgroup@]name
可用的 group 字符串如下:
* NO
* 服务器组。
* UA
* 单独的上游组。
* UG
* 上游组(使用 subgroup)。
* CC
* 缓存组。
* FG
* 过滤器组(使用 subgroup)。
可用的 member 字符串如下:
* request
* 从客户端接收的客户端请求总数。
* in
* 从客户端接收的字节总数。
* out
* 发送给客户端的字节总数。
* 1xx
* 状态码为 1xx 的响应数量。
* 2xx
* 状态码为 2xx 的响应数量。
* 3xx
* 状态码为 3xx 的响应数量。
* 4xx
* 状态码为 4xx 的响应数量。
* 5xx
* 状态码为 5xx 的响应数量。
* cache_miss
* 缓存未命中的数量。
* cache_bypass
* 缓存绕过的数量。
* cache_expired
* 缓存过期的数量。
* cache_stale
* 缓存陈旧的数量。
* cache_updating
* 缓存更新的数量。
* cache_revalidated
* 缓存重新验证的数量。
* cache_hit
* 缓存命中的数量。
* cache_scarce
* 缓存稀缺的数量。
member 与 vhost_traffic_status_limit_traffic 指令相同。
vhost_traffic_status_limit_check_duplicate
| - | - |
|---|---|
| 语法 | vhost_traffic_status_limit_check_duplicate \<on|off> |
| 默认 | on |
| 上下文 | http, server, location |
描述: 启用或禁用 vhost_traffic_status_limit_by_set_key 的去重。
如果启用此选项,则在每个指令(http、server、location)中仅处理一个重复值(member | key + member)。
vhost_traffic_status_set_by_filter
| - | - |
|---|---|
| 语法 | vhost_traffic_status_set_by_filter $variable group/zone/name |
| 默认 | - |
| 上下文 | http, server, location, if |
描述: 获取存储在共享内存中的指定状态值。
几乎可以获取所有状态值,获取的值存储在第一个参数 $variable 中。
- group
- server
- filter
- upstream@alone
- upstream@group
- cache
- zone
- server
- name
- filter
- filter_group@name
- upstream@group
- upstream_group@name
- upstream@alone
- @name
- cache
- name
- name
- requestCounter
- 从客户端接收的客户端请求总数。
- requestMsecCounter
- 请求处理时间的累计数量(以毫秒为单位)。
- requestMsec
- 请求处理时间的平均值(以毫秒为单位)。
- responseMsecCounter
- 仅上游响应处理时间的累计数量(以毫秒为单位)。
- responseMsec
- 仅上游响应处理时间的平均值(以毫秒为单位)。
- inBytes
- 从客户端接收的字节总数。
- outBytes
- 发送给客户端的字节总数。
- 1xx, 2xx, 3xx, 4xx, 5xx
- 状态码为 1xx、2xx、3xx、4xx 和 5xx 的响应数量。
- cacheMaxSize
- 配置中指定的缓存的最大大小限制。
- cacheUsedSize
- 缓存的当前大小。
- cacheMiss
- 缓存未命中的数量。
- cacheBypass
- 缓存绕过的数量。
- cacheExpired
- 缓存过期的数量。
- cacheStale
- 缓存陈旧的数量。
- cacheUpdating
- 缓存更新的数量。
- cacheRevalidated
- 缓存重新验证的数量。
- cacheHit
- 缓存命中的数量。
- cacheScarce
- 缓存稀缺的数量。
- weight
- 服务器的当前 weight 设置。
- maxFails
- 服务器的当前 max_fails 设置。
- failTimeout
- 服务器的当前 fail_timeout 设置。
- backup
- 服务器的当前 backup 设置。(0|1)
- down
- 服务器的当前 down 设置。(0|1)
注意事项: name 是区分大小写的。所有返回值均为整数类型。
例如:
* serverZones 中的 requestCounter
* vhost_traffic_status_set_by_filter $requestCounter server/example.org/requestCounter
* filterZones 中的 requestCounter
* vhost_traffic_status_set_by_filter $requestCounter filter/country::example.org@KR/requestCounter
* upstreamZones 中的 requestCounter
* vhost_traffic_status_set_by_filter $requestCounter upstream@group/backend@10.10.10.11:80/requestCounter
* upstreamZones::nogroups 中的 requestCounter
* vhost_traffic_status_set_by_filter $requestCounter upstream@alone/10.10.10.11:80/requestCounter
* cacheZones 中的 cacheHit
* vhost_traffic_status_set_by_filter $cacheHit cache/my_cache_name/cacheHit
vhost_traffic_status_average_method
| - | - |
|---|---|
| 语法 | vhost_traffic_status_average_method \<AMM|WMA> [period] |
| 默认 | AMM 60s |
| 上下文 | http, server, location |
描述: 设置计算响应处理时间平均值的公式方法。
period 是用于平均计算的值的有效时间。(默认:60s)
如果 period 设置为 0,则忽略有效时间。
在这种情况下,即使没有请求,最后的平均值也会在时间过去后显示。
相应的值为 JSON 中的 requestMsec 和 responseMsec。
vhost_traffic_status_histogram_buckets
| - | - |
|---|---|
| 语法 | vhost_traffic_status_histogram_buckets second ... |
| 默认 | - |
| 上下文 | http, server, location |
描述: 设置用于直方图的观察桶。
默认情况下,如果不设置此指令,则将不起作用。
second 可以用小数表示,最小值为 0.001(1ms)。
桶的最大大小为 32。如果此值对您来说不够,请更改 src/ngx_http_vhost_traffic_status_node.h 中的 NGX_HTTP_VHOST_TRAFFIC_STATUS_DEFAULT_BUCKET_LEN。
例如:
* vhost_traffic_status_histogram_buckets 0.005 0.01 0.05 0.1 0.5 1 5 10
* 观察桶为 [5ms 10ms 50ms 100ms 500ms 1s 5s 10s]。
* vhost_traffic_status_histogram_buckets 0.005 0.01 0.05 0.1
* 观察桶为 [5ms 10ms 50ms 100ms]。
注意事项: 默认情况下,如果不设置此指令,则直方图统计将不起作用。
通过 vhost_traffic_status_dump 指令恢复的直方图不受 vhost_traffic_status_histogram_buckets 指令更改桶的影响。
因此,在通过 vhost_traffic_status_histogram_buckets 指令更改桶之前,必须先删除区域或转储文件。
类似于上述情况,首次使用直方图时删除转储文件。
vhost_traffic_status_bypass_limit
| - | - |
|---|---|
| 语法 | vhost_traffic_status_bypass_limit \<on|off> |
| 默认 | off |
| 上下文 | http, server, location |
描述: 启用或禁用绕过 vhost_traffic_status_limit 指令。
如果启用此选项,则限制功能将被绕过。
如果您希望连接状态网页,例如 /status,而不考虑 vhost_traffic_status_limit 指令,这通常是非常有用的,如下所示:
http {
    vhost_traffic_status_zone;

    ...

    server {

        ...

        location /status {
            vhost_traffic_status_bypass_limit on;
            vhost_traffic_status_display;
            vhost_traffic_status_display_format html;
        }
    }
}
vhost_traffic_status_bypass_stats
| - | - |
|---|---|
| 语法 | vhost_traffic_status_bypass_stats \<on|off> |
| 默认 | off |
| 上下文 | http, server, location |
描述: 启用或禁用绕过 vhost_traffic_status。
如果启用此选项,则流量状态统计功能将被绕过。
换句话说,它将从流量状态统计中排除。
如果您希望在状态网页中忽略请求,例如 /status,这通常是非常有用的,如下所示:
http {
    vhost_traffic_status_zone;

    ...

    server {

        ...

        location /status {
            vhost_traffic_status_bypass_stats on;
            vhost_traffic_status_display;
            vhost_traffic_status_display_format html;
        }
    }
}
vhost_traffic_status_stats_by_upstream
| - | - |
|---|---|
| 语法 | vhost_traffic_status_stats_by_upstream \<on|off> |
| 默认 | on |
| 上下文 | http |
描述: 启用或禁用 upstreamZone 的统计。
如果禁用此选项,则流量状态统计功能中的 upstreamZone 将被绕过。
换句话说,它将从流量状态统计中排除。
如果您希望禁用上游服务器的统计收集以减少 CPU 负载,这通常是非常有用的。
http {
    vhost_traffic_status_zone;
    vhost_traffic_status_stats_by_upstream off;

    proxy_cache_path /var/cache/nginx keys_zone=zone1:1m max_size=1g inactive=24h;
    upstream backend {
       ...
    }
    ...

    server {

        ...

        location /status {
            vhost_traffic_status_display;
            vhost_traffic_status_display_format html;
        }
        location /backend {
            proxy_cache zone1;
            proxy_pass http://backend;
        }
    }
}
vhost_traffic_status_measure_status_codes
允许在 Vhost 流量状态模块中跟踪特定的 HTTP 状态码或所有状态码。
| - | - |
|---|---|
| 语法 | vhost_traffic_status_measure_status_codes [all] [status_code1] [status_code2] ... |
| 默认 | off |
| 上下文 | http |
参数
status_code1, status_code2, ...:要跟踪的特定 HTTP 状态码(100-599)all:跟踪所有 HTTP 状态码
示例
跟踪特定状态码:
vhost_traffic_status_measure_status_codes 200 404 500;
跟踪所有状态码:
vhost_traffic_status_measure_status_codes all;
描述
- 默认情况下,不启用特定状态码跟踪
- 状态码必须按升序排列
- 仅接受有效的 HTTP 状态码(100 到 599)
发布
要发布版本,请创建一个带有 git-chglog 的变更日志条目 PR
version="v0.2.0"
git checkout -b "cut-${version}"
git-chglog -o CHANGELOG.md --next-tag "${version}"
git add CHANGELOG.md
sed -i "s/NGX_HTTP_VTS_MODULE_VERSION \".*/NGX_HTTP_VTS_MODULE_VERSION \"${version}\"/" src/ngx_http_vhost_traffic_status_module.h
git add src/ngx_http_vhost_traffic_status_module.h
git-chglog -t .chglog/RELNOTES.tmpl --next-tag "${version}" "${version}" | git commit -F-
在 PR 合并后,在 GitHub Releases 创建新标签和发布。
另请参见
- 流量状态
- nginx-module-sts
-
Prometheus
-
系统保护
- nginx-module-sysguard
GitHub
您可以在 nginx-module-vts 的 GitHub 仓库 中找到此模块的其他配置提示和文档。